00:00All right, guys
00:00Welcome back to the channel
00:01It's Jason Pazino with tiainvestor.com
00:05Bitcoin, it's now or never
00:05Hit the like button, subscribe to the channel, and if I have time, we'll also get into gold as well
00:14If it's in a similar position with the old now or never
00:16Now, I don't want to start the whole thing out with 100% doom, even though it is a now or never
00:25often what we see with the at this sort of time when the market is basically sitting at a knife's edge obviously and if you guys get the uh the joke it can go up or down from this point but I want to give you the probabilities so that we could at least get a more educated guess on where we think the market is going
00:48Now, often when we get to the now or never, in a bull market, it takes the now approach
00:56In a bare market, it takes the never approach
01:00And of course, that's just related to timing as well
01:04Eventually, things turn around
01:04They always do
01:05But how much longer is it going to take for things to to turn around? The now or never most recent time was the low in August
01:13Just looking at uh you know how things progressed from that point
01:20You can see August low
01:22It was getting pretty dire
01:22We take a look at the fear and greed index
01:24Let's open up that
01:28And through that low, we could just see things bumbling along right around extreme fear and then putting in slightly higher lows into fear, right? and the price was just struggling to get any higher than uh that sort of 63 or 64,000 until it finally took off and we had some volume come right back through
01:51So I'm looking at right on the right hand side of the chart now and you can see that the sentiment really did well it picked up once it broke out but there was a little subtle sign that we were coming through here
02:03Now I I'm not going to say I I sat here and called that perfectly
02:08Definitely not
02:08my signals were coming through on the breakout of the 200 day and the 50WE and the volume
02:16The volume is super important because you need to see the follow through uh for from the market and the buyers to take the next step that the market needs to take if it's going to change direction
02:26So basically the the now or never comes at these really critical points also similar to June and July
02:33This was when we saw the market begin to turn around
02:35That was the 1 of July
02:35uh significant reversal candle
02:38Let's zoom in so we can see that the candle basically wiped out all of the prior days losses
02:46And through this whole period, this was when Michael Sailor and Strategy and all sorts that were going absolutely terribly
02:53They were just going lower, lower, lower
02:57It was just getting really bad
02:58But Bitcoin was holding out relatively well
03:00So to clean up the chart a bit here, we can see that in these in these times when we get the nows or never approach, it really is that time
03:12If that was to break down, and I hate how this There we go
03:14The tool's doing it
03:17Uh if that began to break down from that point, then that was going to be a never
03:21It's really It doesn't really come into effect through the middle of of moves
03:26You know, it's not really through these sections
03:28It's not really the the call of a now or never
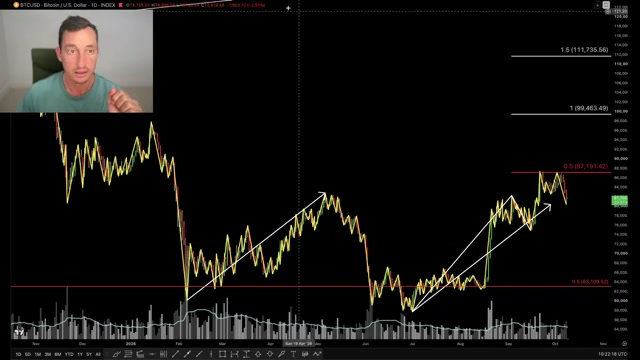
03:31It's really at the critical points like now where we've come back to test the tops
03:36We've come back to test the double top
03:38So that's right around here and here that 82 grand
03:40Today's action brought it down yet again after uh the day before closing down as well
03:50And we've just got the new daily close which is sitting in the balance here
03:55It's below the prior tops in May
03:55So the close on today was around 181,700
04:03The prior tops in September is we're just above that now
04:06So that's okay
04:06But we're just below the May tops
04:09So it's right in the middle of basically, as I've said, the the old now or never
04:14On top of that, we've now been rejected off the highs multiple times
04:20So the highs at 87,200 and 87,400
04:28So that was a critical level
04:28You can see that, you know, what we talked about in yesterday's video, that whole price range has now been rejected at half of that range, which is not a great sign
04:39You want to see buyers stepping in and getting the price action to follow through in a greater movement than what it had prior done because that would then show that more buying action is coming back, more money is coming back, more momentum is coming back for the buyers
04:55It's not over until like they say the music ends and some key areas now which we know was 82,000
05:06We've got a daily close under it
05:06So, let's see what happens at the end of the week, which which is only a few days away
05:11And we have a weekly swing low here at 74K
05:13Let's get a little bit of a clearer number there
05:16Just short of yeah, just under 75
05:19So, give or take a little here under 74
05:21If you got some closes underneath that level, then you're basically back into a pretty weak territory
05:28So, we've seen that several times before in the bare markets
05:31The now or never approach basically shows up that it's going to be a never
05:39It just keeps going down
05:39In a bull market, you want to see things turn around from this point to add fuel to that fire
05:48Uh this is the chart I want to show you
05:51The search volume for crypto and Bitcoin is struggling really bad
05:56This is where are we at now? 14
05:59We're at 12 just a moment ago, but let's take a look at 14 here for Bitcoin on the search volume going back, you know, 2004
06:06Um, obviously, you know, Bitcoin was around from from this point, but the point is this is coming up to a sixyear record
06:18So, Bitcoin at 14, go back to October, September of September, October of 2020, we were also at 14
06:25So this is just the entire search volume rated against the search volume
06:31Um you know it's dynamic here with a top of 100 and bottom of zero of course but this is the same reading that we saw back in October of 2020 and that was before the major Bitcoin breakout point
06:42So it was a another critical time
06:45September had the pullback
06:47So just if you weren't around at that time this is July August
06:53There's August pullback into September
06:55pretty critical October and this is basically exactly six years ago today
07:01There's a Thursday 8th, Friday 9th
07:04That's exactly what we've gone through and that was a breakout point
07:05You started to see some volume come back through, broke the short term and then come late October 21st, you broke all you broke all of those tops on that bar with increased volume
07:19Now or never point, right? It was it was a pretty dire pullback that we saw into September
07:25Higher lows formed and then it just took off and we did not see the market return from that point
07:30And that whole breakout above the highs there of 12,000 that was also a um this is getting annoying
07:37That was a double top from August 2019 and August 2020
07:39So it had to do a lot of work through that period
07:46You saw a lot of energy and momentum come back through in October 2020
07:51October 2021 also another critical time there
07:54So around that that timing where you'd want to see this market get going
07:58October ran to a new all-time high in 2021
07:59In 2022 was a bare market
08:03It was attempting to put in a bottom right around now
08:05So it's exactly four years ago
08:07You've got 13th of October
08:10Really critical area there
08:10And there was also a very significant low now in the stock market which reversed the uh reversed the trend of that bare market of the S&P 500
08:20So you had this rally FTX happened and then it went sideways to accumulate until the next move 2023 October critical timing as well
08:28Look at that
08:3116th began to break out
08:3123rd massive breakout above those highs right across the top there and it happened on increasing volume both times that continued to follow through into January
08:44So, it was a pretty strong move there
08:46October 2024, another critical time
08:50You had the the first part of the breakout
08:52Oh, here we go
08:54Earlier on 14th volume starting to come back right down here
08:59more volume coming back and then we broke through into early November
09:03That was after the presidential elections, but you've got the breakout here in midocctober, another breakout in late October, and then a huge breakout in early November
09:14So, this was a time when the market was building and building and building with some more energy
09:18That was 2020 4
09:21So we had 23 breakout, 24 breakout, 25 all-time high on the 6th
09:29Then we had a massive collapse on the 10th
09:31So again, pivotal times in the market, all-time high, do or die, needed to continue
09:37It needed to follow through with that momentum and it died off from that point
09:42So that was 2025
09:42Now we are 2026 October and we're going in the wrong direction here
09:50We're heading down through this time when uh you know we want to see the market begin to break higher
09:55Can it happen today? You know we've still got a few more days 9th 10th 11th 12th 13th as you seen historically it's been that time in the market where midocctober comes with some sort of volatility and it's usually running in the direction of the trend except if you're right at the all-time high
10:14Look at that alltime high late September into early October and then you had a huge pullback into October
10:19So there was still a lot of volatility
10:21Each of these occasions saw the volatility begin to increase
10:24And in the case of 2025, the volatility is basically some of the largest volatility we've seen in in crypto ever
10:3020 billion on that day on the 10th
10:34So we're coming up to that in the next two days, the anniversary, one-y year anniversary of the 20 billion liquidation
10:39Everyone crying out manipulation and Binance's fault and this and that
10:45you know, they cry when it goes down, but then they don't talk about manipulation when it goes up
10:50And yeah, that's just my little side rant there
10:54So, two major things here
10:57One is the $82,000 level
10:57Two is the interest
11:03Overall, it is back to a sixyear low
11:07It's not a record that you want to break
11:09And it is a at a critical point
11:12Usually when it gets this low, we see a reversal, some sort of interest, something pick up here
11:16Hopefully, it's to the upside for the bulls, but interest in the search volume can also pick up if the price breaks down
11:21You know, people start searching what's happening to Bitcoin uh Bitcoin news, Bitcoin update, this and that, and that's going to that could shock this um reading here for Google Trends to go up
11:33But um yeah, just be on the lookout here cuz we're at six year lows and we've been putting in lower highs all this time, which is part of my theory about Bitcoin, which um you know, I've continued to explain over the last 12 months, which is why I don't think we're going to see any sort of significant bull market from Bitcoin for quite some time
11:53Top's still, you know, 100 150K
11:53I don't see that as anything substantial
11:59And uh we'll know soon enough whether this 87 top is um you know like the the local top for the rally here
12:05But ideally it's it's not
12:07We get the the timing now where we see a bounce for the bulls start to run higher and um go from there
12:15But you know just beware because we've hit the 50% multiple times which is not a strong signal
12:20We're on the border of breaking back down past the bullish breakout which is another weak signal
12:27if it breaks the bullish breakout
12:28Look at that massive breakout bar
12:30All of the noobs came back on the 21st to buy up the breakout and that's noted on the sentiment
12:37It's noted on the price chart and it is noted in the volume, right? We talked about that at the time and this was a time when everyone started to to slag on the the folks who have been bearish on the way down explaining why the bare market was continuing rather than just being a um you know a blindsided bull buying all the dips
12:58And right now the price has basically wiped out that entire bar
13:01So we've wiped out the the gain of the 21st of September which was about 6.7%
13:10Okay
13:12So that's the critical level now 82k and then for some final u hope hold the 75 $74,000 um swing low there
13:22All right so critical time here for for Bitcoin
13:23Now the [clears throat] exchange volume has also continued to die off
13:30This isn't as um concerning because we often see this around the the period where Bitcoin will break out into a new bull market
13:37you know, attempt to reverse the macro bear and the exchange volume here usually dries up, comes back to test some of these lows
13:47But if it starts to hold beneath the low of 15 billion, then things are looking much weaker
13:51So keep an eye out on that uh you know over the next few weeks pro probably the next few months because that's similar to what happened last
13:59have a bounce
13:59Interest was lost, but the positive was that the price action was holding higher during the second half of 2023 while the volume was still drying up and that then led to a a liquidity squeeze which pushed the price higher
14:15So, that was the positive there
14:17Hopefully, that could be part of the the movement here for for the bulls
14:21Now, I just wanted to remind you that we've got TIA Pro on sale
14:22There's a link in the video description
14:25If you're trying to manage your portfolios through the peak and the trough of the cycle, the economic cycle, looking out for other opportunities besides Bitcoin, and you're interested in the stock market, commodities, uh the real estate market, then this would be the place for you guys to go
14:39Links in the top of the video description
14:43So, Bitcoin, I think we've covered that extensively
14:47USDT
14:49Uh, taking a look here, USDT and USDC has bounced off its 50% now
14:53So, an area that you would expect to see support for stable coins to come in and some of that rotation back into profits
15:00So, selling off Bitcoin, selling off crypto, going back into stable coins has seen a bounce
15:07Now, that's this is why I'm not overly concerned yet is because we've seen this in the past where you put in a low or in the case of the stable coins, you've got a high and then there's a bit of distribution occurring until the the next leg of the the run moves
15:21But if we're to see this hold up and then the bounce come somewhere above 11 12%, you can see where the line is here, 11.6, six
15:32That would then start to put a little bit more pressure on crypto, Bitcoin, the whole risk side of things because there is more money now piling back into stable coins
15:43All right, so keep the 11 12% in mind
15:45We'll keep watching it here on the channel as well
15:50That would then put things into a little bit of a stronger position for stable coins and people just getting a little bit um you know, more riskadverse, taking their their profits out, which could be this pump that we're seeing across the board
16:01Well, this recent pump that we saw on ETH, Soul, other uh altcoins as well
16:06So, you can see with ETH, it's peaked out on that same day that Bitcoin did
16:10It's pulling back to those um prior lows at around 2,300, 2350
16:15Haven't broken yet
16:15So, again, do or die is my this is the way I'm seeing it anyway
16:20You know, you're welcome to call it whatever you want
16:22Uh Salana back towards those highs
16:24So, it's still holding for now around 105
16:26Swing lows are at 90
16:29call it $96 and that's the prior tops before that last breakdown in June of 2026 higher lows and so on
16:35So it's still a pullback here is still okay
16:40You just don't want to see the structure breakdown
16:41You don't want to see it break back below uh in the case of Bitcoin below the moving averages and for the in the case of the altcoins generally you want to see it hold remain above the re the accumulation lows and ideally above the reaccumulation before that pump
17:01So for Salana somewhere around 90 bucks is going to be relatively safe
17:03It starts to break below that and you're looking towards 8580 that's going to be back into the weak position
17:09So keep an eye on that as well
17:11And for XRP, it actually put in a lower high and failed from that point
17:18So now we're looking back towards the low and the accumulation zone
17:23So around 130 and ideally it remains just above about 1151 120
17:29So not too far off that now only at $138
17:31So getting a little bit uh critical there
17:34Case of Zcash
17:34This is uh next week we'll find out with the overbalance in time and price
17:39So, do we see a more macro breakdown here for Zcash and the top is in
17:43I mean, if you were a betting person and you liked to protect profits, you probably would have done that by now
17:50Protect some of those profits
17:52That's been an absolutely mega move here for Zcash
17:55At the moment, the move has exceeded the prior correction in price, but time comes next week
18:00And that takes me to recap Bitcoin's uh overbalance in time and price
18:07Remember, we're watching the same thing here
18:09This is just a a momentum shift from buyers to sellers, sellers to buyers
18:13And so far, it's been mostly sellers, right? And the and right now we're attemp well the market is attempting to take over with the buyers
18:21And the buyers have not yet completed the pattern
18:24The completion will be above 87,000
18:30And it has to happen now
18:30and the moment you can see how this has gotten really critical to the exact timing the price itself and it's so far failing
18:38All right, so it needs to hurry up and get there
18:42Otherwise, if the momentum picks up to the downside, then it's probably off and you've just got a roughly balanced rally here, which is which is not fantastic
18:54Okay, I said I would have a look at gold as well
18:56Uh, I I'll I said I would also have a full video on gold, but um because it's the end of the week, I think I'll just do an update here and then get to it next week
19:03There was that critical day down in October uh uh sorry, Wednesday, 7th of October, and it's attempting to bounce, but you can see the volume coming in on each of these down bars and the volume trying to return here
19:19Yesterday was the best case of a rally against the short-term trend
19:25Let's zoom right in
19:28But it has not reclaimed the tops
19:28So anything above 42, it has not reclaimed 43 which were the prior lows before the breakdown just through there
19:38And at the moment the trend is still down
19:40So it's got a lot of work to do considering as I talked about with with Bitcoin the weakness that you see
19:47If you get a breakout like we talked about in August, if that breakout comes back into the reaccumulation zone and stays in here, that's a weak signal
19:56Why? You got to ask yourself, why did everyone that was buying here? Why aren't they still holding? Why did the price get back into this zone? I don't know the answer, but it normally is not a good answer
20:10And that answer happens to come out in the next few months because the news follows the price action
20:16So, these guys have obviously seen something not right in the market
20:20They were attempting to buy and hold on
20:23It did not come through
20:23It got it failed at our 50% level of $4,800 that I've shared with you many, many, many times
20:30And so far, the uh the buyers have said this is not the time
20:35They've sold off, sold off, and sold off because the price is back to the accumulation zone
20:39So, they're saying it's not ready yet
20:41It's going to take some more time
20:42Maybe it accumulates again and takes out 48
20:45But um yeah, last times it's happened for the last 50s something years, the narrative has always been different
20:54And I know there's going to be people that say this time is different because the government, because money printing, because inflation and China's buying and they're all buying and this and that
21:06Everyone knows that
21:06It's just to me it's just silly to keep repeating the narratives that everyone knows
21:10Everyone knows it
21:13It's usually in the price
21:13So the the the bullish gold channels and the gold bugs and all those guys, their main game is to tell you to buy gold and buy it using their their link to gold and silver and they have nothing else to give
21:29They never talk about the the selling because that would not be making them any money
21:34I'm just following the chart and I trade long and I'll trade short or I'll take profits at least at the very least and uh just have a look at what history has shown because it'd be stupid not to learn from history
21:43So enough of my rant there
21:46History at the top of 2011 the market came back to that previous low consolidated and attempted the rally again
21:54So there was still another chance to test those highs but it failed and came back into that prior zone and it attempted again and it failed again and then it collapsed
22:01that happened within 18 months
22:03So it's a long time frame there
22:05Now in 2008 there was a test 50%
22:09So you can see how here rallied up these lines are killing me
22:17It came up tested pulled back tested again failed
22:22All right
22:22And then it created a new reference range
22:24All right
22:24It attempted that again
22:27And this is the difference
22:31The difference is that when it rallied, it held and then began to consolidate much higher
22:36That's the difference
22:39Right now, we're seeing the rally up into the 50 and we're seeing the fail
22:43So, we're back down to here
22:45You can see this time it held above the 50
22:47That was the strength in the move
22:48The same thing happened through that zone there in 2006, 2007
22:53There was a couple of tests, put in a higher low, and then continued to rally
22:57So, a few differences there uh with gold and we're waiting on that to happen now
23:02We're waiting to see if we're going to get some strength and rally higher
23:04Otherwise, this then puts in a fresh low or this um this accumulation
23:11There's another chance that we run up somewhere around 46 $4,800 and test, right? We've got to see closes above 48 for the strength in the bull to get higher for this whole end of cycle collapse in the US dollar yada yada narrative that they've been building up for decades, mind you
23:27You know, it's been happening for decades
23:29Okay, we have the interest rate announcement coming up in a few weeks for the US and it looks like we're going to get a pause here
23:36So, 82%
23:36And next week, there are a few big uh headlines here for the US CPI and PPI
23:43Australia have our unemployment and then there's nothing really going on for a couple of weeks until we get to the end of October with the Fed's Fed funds rate meeting coming up
23:52So interest rates looks like that's going to be a pause and that takes us out to early November where we get the midterm
23:59So we got a little bit of time to go there and it looks like it's coming through on the stock market now with a few pullback days
24:05So I will endeavor to update you guys again next week
24:08Have a fantastic weekend
24:11Don't forget TI A Pro
24:11Get on board with that if you're looking to expand your portfolios and get away from the um you know just the the typical retail stuff
24:21Uh have a fantastic weekend
24:24I'll see you at the next one
24:25And until then, take care and peace


 Bitcoin is at a critical juncture, facing a "now or never" situation where it must break above key resistance levels or risk a significant downturn.